Book metrics widget
Posted on 2022-04-28
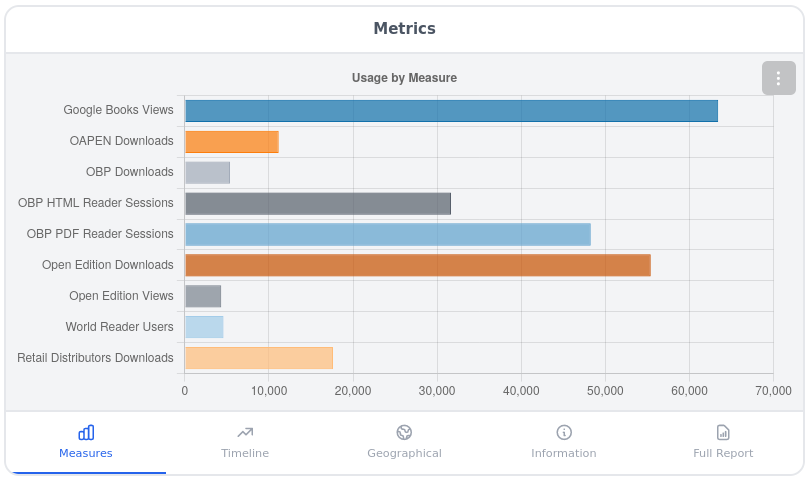
This Node package is used to display book usage statistics on Open Book Publishers’s new website, consuming a HIRMEOS Metrics API. Their new website is made using NextJS and this package uses React, Tailwind CSS and few libraries based on them. It uses REST API to query the DOI of the book on each book pages to get the data. Then the data is parsed and JavaScript object is created based on the data. This object is then passed on to functions that display the data as a graph, timeline and geochart. There is also another object created using the same data to download as a CSV file. The generated graph, timeline and geochart can be downloaded as an image.
This took about 15 weekdays and 2 weekends so about 17 days total. Including setting up the PC and learning web development from scratch (I’ve never done web development before except very basic HTML, CSS and JavaScript).
The things that I learned are HTML, CSS, JavaScript, React, Tailwind CSS, GitFlow branching model, NextJS, Node packaging, GitHub workflow, little bit of webpack, little bit of postcss and little bit of babel.
All I can say is that I learned a ton. I would say it is about the same as two years of university study.